


Before having a detailed analysis on Bajaj Finance share price and it’s future, first we need to have an overview of the company and it’s yearly growth. So let’s get started.

Company Overview of Bajaj Finance
Bajaj finance is an Indian non-banking financial company ( NABC ) which is mainly engaged in the business of deposit taking and lending. It was incorporated on 25 March, 1987 and it’s head quarter is located in Pune, Maharashtra. It was originally incorporated as “ Bajaj Auto Finance Limited “ but later it issued it’s IPO to public and actually entered into the finance sector.
The major functions of Bajaj finance includes accepting public and corporate deposits, providing lending facility to retailers, small and medium sized enterprises and commercial customers. It also offers variety of financial services products to it’s customers.
Bajaj finance is a subsidiary company of Bajaj Finserv Ltd. Bajaj Finserv Ltd. holds 57.28% shares of Bajaj finance. Bajaj finance has it’s main focus on rural and urban areas of the country because out if total 2,988 locations, 1,690 are present in small town and village areas.
To talk about current management team of Bajaj finance, Rajeev Jain is the managing director, Anup Saha is the deputy CEO, Sandeep Jain is the chief financial officer, M M Muralidharan is the treasurer and Fakhari Sarjan is the chief risk officer of Bajaj finance ltd.
Year Wise Business Growth Of Bajaj Finance
Year 1987-1999
On 25 March 1987, Bajaj auto finance was incorporated as India’s most popular two wheelers finance company. It was established with the main purpose of eliminating long wait time period for finance to customers. Later in the year 1988, it was registered as public limited company and in 1998, it was officially registered as non-banking finance company with RBI.
Year 2000-2010
In year 2000-2010, Bajaj finance expanded it business from two wheeler finance to business, property and other personal finance this was the success period for Bajaj finance when new partnerships was created and news technologies were adapted by the company.
The profit of the company started rising like a rocket. In year 2000 it’s annual disbursement was RS. 500 crores which doubled in year 2006 to RS. 1000 crores. And, finally on 6 September 2010, the company changed it’s name from Bajaj auto finance to Bajaj finance.
Year 2011-2015
In the period, the company focused more on innovation in finance sector and launched India’s first and only one EMI card and flexisaver. The company’s shareholder’s fund crossed 2,000 crores milestone and there was rapid growth in the number of customers.
Till the year 2015, the company was able to serve over 4.92 million customers. In this period, the company also launched doctor’s loans and new version of wealth management with three channels such as relationship management channel, a tele RM/video RM channel and independent financial advisor channel in the partnership of HDFC life company and Bajaj Allianz General Company.
Year 2015-2019
In this period, there was high growth in company’s number of customers, income and profit. The consumer durable business grew by 23% and digital products business grew by 84%. The company also launched retail EMI card to provide small loans and offered care finance.
In year 2016, the company made highest loan record than ever. In year 2018-2019, the company made highest profit than ever. In this period, BFL was also awarded with many awards and good business ratings.
Year 2019-2020
This was the challenging period for Bajaj finance because of the coronavirus pandemic. There was direct effect on company’s performance, income and profit. However, in this period too there some good achievement for the company like AUM grew by 27%, customer Franchise crossed 40 million mark and company expanded it’s locations to 2,392 places in India. Bajaj finance securities limited was also started to offer loan against securities.
Income Growth History of Bajaj Finance Limited
If we research in detail about the business model of Bajaj finance, we will know that the company make good profit by financing the dream of customers. It provides finance to the customers to buy something and for that it changes commission from selling companies.
It also generates it’s income by taking some processing fess ( 2-3% ) from customers. Besides this, the company also get free data of the customers that it uses for cross selling of the products. It also charges penalty if customer is unable to pay EMI on time.
The company generates income and profit from following sources:
1) Consumer Lending – 39% of the total profit
2) SME Lending – 13 % of the total profit
3) Rural Lending – 8% of the total profit
4) Commercial Lending – 4% of the total profit
5) Loan Against Securities – 5% of the total profit
6) Mortgages – 29% of the total profit
There was yearly 60% growth in the loan of company.
Year 2007:
Total Revenue = 399.38 Crores
Total Expenses = 328.40 Crores
Total Profit = 47.64 Crores
Year 2008:
Total Revenue = 493.14 Crores
Total Expenses = 464.14 Crores
Total Profit = 20.58 Crores
Year 2009:
Total Revenue = 593.87 Crores
Total Expenses = 545.52 Crores
Total Profit = 33.91 Crores
Year 2010:
Total Revenue = 893.08 Crores
Total Expenses = 763.75 Crores
Total Profit = 89.41 Crores
Year 2011:
Total Revenue = 1406.13 Crores
Total Expenses = 1036.26 Crores
Total Profit = 246.96 Crores
Year 2012:
Total Revenue = 2171.92 Crores
Total Expenses = 1569.69 Crores
Total Profit = 406.44 Crores
Year 2013:
Total Revenue = 3111.37 Crores
Total Expenses = 2239.77 Crores
Total Profit = 591.31 Crores
Year 2014:
Total Revenue = 4073.33 Crores
Total Expenses = 2982.17 Crores
Total Profit = 719.01 Crores
Year 2015:
Total Revenue = 5418.23 Crores
Total Expenses = 4061.29 Crores
Total Profit = 897.87 Crores
Year 2016:
Total Revenue = 7383.48 Crores
Total Expenses = 5418.91 Crores
Total Profit = 1278.52 Crores
Year 2017:
Total Revenue = 988.97 Crores
Total Expenses = 7171.45 Crores
Total Profit = 1836.55 Crores
Year 2018:
Total Revenue = 13,329.22 Crores
Total Expenses = 9272.86 Crores
Total Profit = 2646.76 Crores
Year 2019:
Total Revenue = 17,399.27 Crores
Total Expenses = 11,363.97 Crores
Total Profit = 3890.24 Crores
Year 2020:
Total Revenue = 23,834.15 Crores
Total Expenses = 17,026.02 Crores
Total Profit = 4881.12 Crores
Year 2021:
Total Revenue = 23,546.33 Crores
Total Expenses = 18,183.45 Crores
Total Profit = 3,955.51 Crores
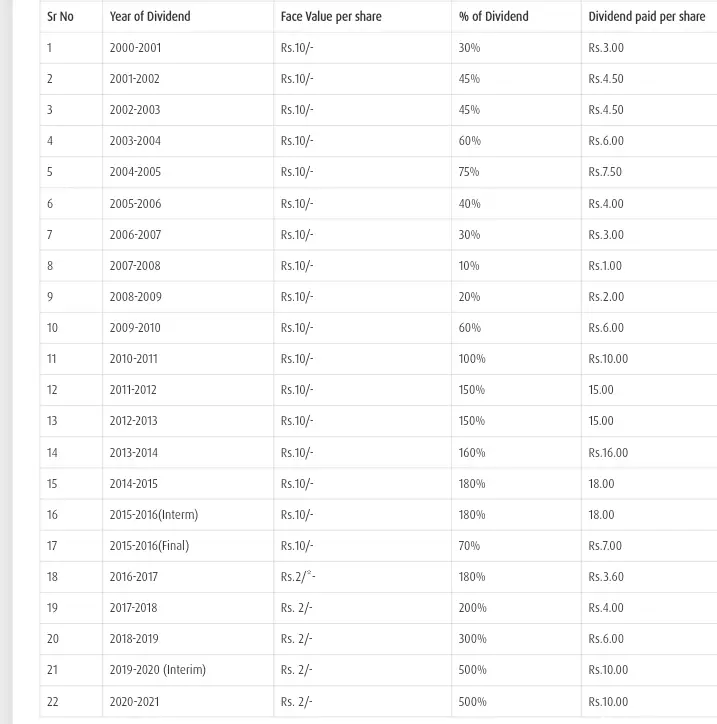
Dividend History of Bajaj Finance ( PYear 2001 to Year 2021 )
Bajaj Finance Share Price Analysis and Future Prediction
Share Price History ( From 2001-2020 )
Year 2001: High Growth : 17.60% in November, High Fall : 8.27% in July
Year 2002: High Growth : 20.13% in January, High Fall : 19.81 In July
Year 2003 : High Growth : 19.24% in November, High Fall : 6.84% in March
Year 2004: High Growth : 15.69% in September, High Fall : 14.48% in January
Year 2005: High Growth : 24.38% in My, High Fall : 19.36% in October
Year 2006: High Growth : 16.11% in January, High Fall : 10.07% in November
Year 2007: High Growth : 32.93% in November, High Fall : 8.50 in October
Year 2008: High Growth : 21.36% in August, High Fall : 47.23% in June
Year 2009: High Growth : 53.18% in May, High Fall : 8.04% in January
Year 2010: High Growth : 33.87% in April, High Fall : 8.66% in November
Year 2011: High Growth : 14.88% in July, High Fall : 16.51% in January
Year 2012: High Growth : 23.84% in January, High Fall : 2.79% in May
Year 2013: High Growth : 20.07% in May, High Fall : 17.39% in July
Year 2014: High Growth : 13.97% in March, High Fall : 3.17% in January
Year 2015: High Growth : 29.10% in June, High Fall : 8.89% in August
Year 2016: High Growth : 29.71% in July, High Fall : 14.86% in November
Year 2017: High Growth : 24.03% in July, High Fall : 4.08% in November
Year 2018: High Growth : 17.49% in July, High Fall : 24.11% in September
Year 2019: High Growth : 21.41% in September, High Fall : 11.66% in July
Year 2020: High Growth : 48.35% in November, High Fall : 50.38% in March
Year 2021: High Growth : 20.82% in August, High Fall : 10.59% in January
Future Of Bajaj Finance Share Price
Baja finance is one of the highest growing Indian non-banking finance company. It has made RS. 10,000 investment to over RS.1,00,00,000 from 2006 to 2021. To talk about it’s price, the Bajaj finance share price was only RS. 4 in year 2008 and currently in year 2021 it is 7000+. There has been 37%+ growth in EPS of the company in last 10 years. In year 2015, EPS was 18, in 2016, EPS was 24, in 2017, EPS was 33, in 2018, EPS was 43, in 2019, EPS was 69, in 2020, EPS was 88, 2021 73.
The first time in history there was a certain decrease in the EPS of company in year 2021 because of Coronavirus pandemic. So, in this way, if there is same percentage of growth in the EPS of the company in next five years then in year 2026 the EPS will be about 400. So, if we calculate in deep on the basis of eps and PE growth of the company then in year 2026, the share price of the company will be about 20,000 in year 2026. But it highly depend on business growth of the company.
More About Bajaj finance: https://www.bajajfinserv.in/finance-about-us-about-bajaj-finance-limited
Read our Other Articles: